Introducing Synadia Insights: see inside your NATS system

When an application starts timing out and NATS is in the blast radius, most teams hit the same wall: they can see that something is wrong, but they can’t drill into the specific wheres, whys, and hows.
Metrics show rising latency. Dashboards show climbing error rates. But the questions that actually matter during an incident are far more specific: Which connection, stream, consumer, or account is causing the pain? What changed to trigger it?
The clock is ticking. Customers are asking questions. But without entity-level visibility into what’s really happening or what’s changed recently, teams roll the dice and play whack-a-mole.
The tooling gap is real
Existing approaches to monitoring NATS have real limitations:
Too manual
The NATS CLI is powerful, but it requires deep expertise to wield effectively during an incident. You don’t want to be hunting for the right commands and flags under the stress of a production outage.
Low cardinality
Prometheus-based monitoring aggregates NATS metrics into counters and gauges — fine for dashboards, useless when you need to know which stream, which consumer, which connection is the problem.
Point-in-time only
A snapshot of current state tells you nothing about what changed. Without historical context, you can’t distinguish a new problem from an existing condition. Every incident starts from zero.
The result: debugging a NATS incident means jumping between the CLI, Grafana dashboards, and Slack threads, manually correlating data across tools. The root cause takes hours or days to surface.
Synadia Insights
Today we’re introducing the tool that solves these problems.
Synadia Insights is deep monitoring for production NATS systems. It gives ops and platform teams the tools to pinpoint the exact NATS entities — connections, streams, consumers, accounts — driving performance issues, so they can remediate faster and prevent future incidents through proactive optimization.
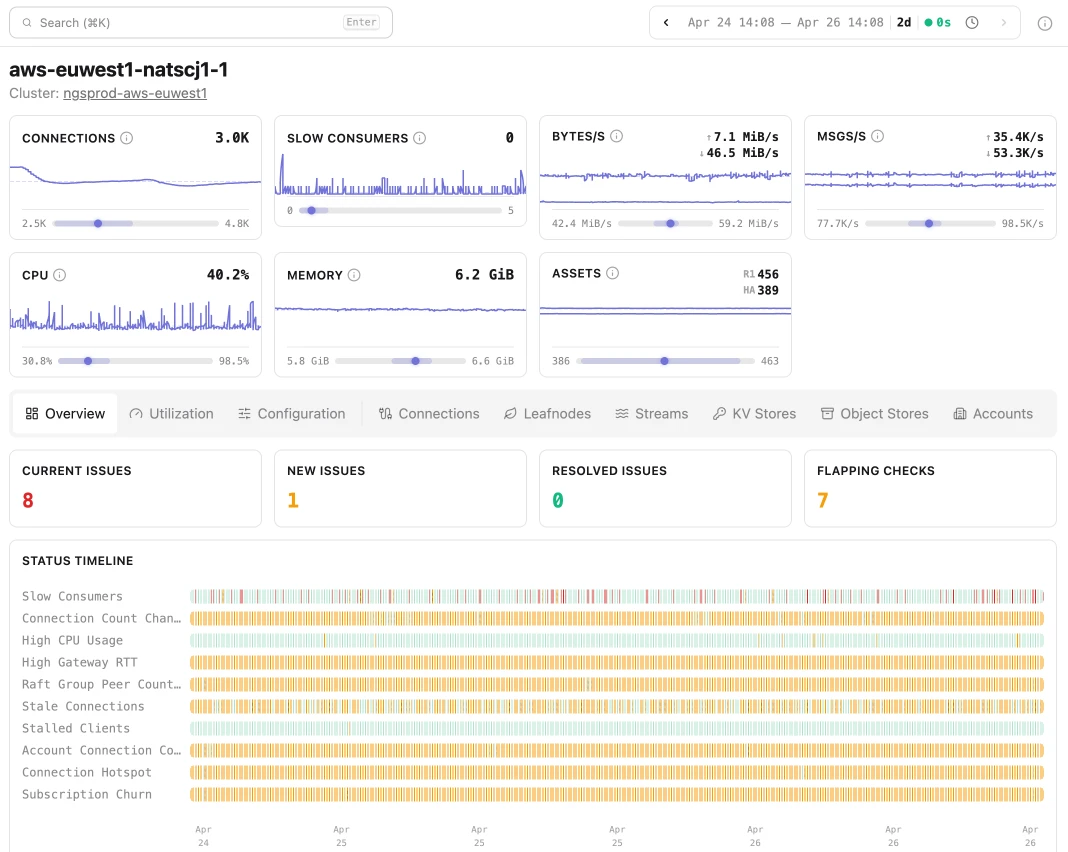
Navigate your system as a graph, not a flat list.
Insights maps the full topology of your NATS deployment. Every entity is linked: clusters, servers, connections, streams, consumers, accounts, users. When something’s wrong, you follow the graph to the source. No more manual correlation.
Time-travel through your system’s history
Insights captures a complete snapshot of system state at every scrape interval. This gives you time series views of all system data, the ability to diff state between any two points in time, and a way to correlate NATS behavior with external events. “What was different two hours ago?” finally has an answer.
Signal, not noise
Insights was built by the team that created NATS. Its data model and heuristics encode years of operating and supporting NATS at scale. This isn’t a generic monitoring tool with a NATS plugin; Insights understands NATS semantics like fan-out patterns, slow consumer cascades, JetStream replication, and meta cluster leadership. That deep understanding powers everything in the product, especially Checks.
Built-in Checks that know what to look for
Insights ships with a library of 100+ built-in Checks — purpose-built diagnostics that identify NATS-specific failure modes across your deployment. Checks either identify issues or flag areas for optimization. They cover six categories:
- Health & Availability — Is the system up and reachable?
- Performance & Latency — Is the system fast enough?
- Error & Failure Patterns — What is failing, and how?
- Resource Saturation — Are resources running out?
- Data & State Consistency — Is the data correct and coherent?
- Change & Deployment — What changed recently?
Each Check includes remediation guidance — what happened, where to look, and what to do about it. View the full Check library →
Never miss a critical finding. Subscribe to a dedicated NATS subject and get alerted to new Check results in real time. No dashboard polling required. Docs →
How Insights Works
Download a single binary. Point it at your NATS system. That’s it, you’re up and running.
Insights is a standalone product that works with any existing NATS deployment, whether you’re using operator mode or config mode. The only hard requirement is that you have system account credentials to connect with.
Full data capture with zero overhead
Insights scrapes and indexes everything NATS exposes through its native system account monitoring endpoints, at a configurable interval. It’s read-only and can’t see message payloads — system account users don’t have that access. The result is a complete, queryable picture of your system’s state and behavior, continuously refreshed.
Embedded SQL data store
Insights was designed to flex based on your use case. Out of the box, Insights runs an embedded DuckDB instance, so you can spin up ad-hoc monitoring quickly. If you want to run Insights as a service, durable, file-based storage and HA configurations are also supported. Either way, query results are blazing fast. More on deployment models and tiered architecture →
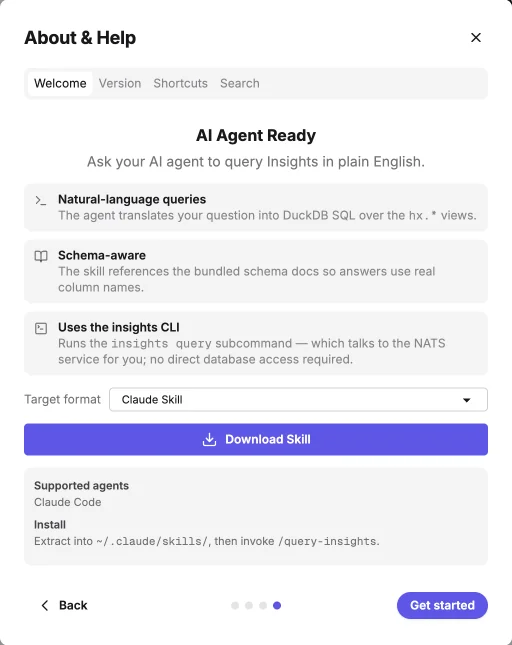
Natural language exploration via the AI Agents & the Insights CLI
Think of this as the headless version of Insights. The UI lets operators browse Check results and traverse the entity graph as they drill into hot spots. The Insights CLI opens something different: pair an LLM agent with the bundled insights query subcommand and a schema-aware skill, and your agent can explore the entire dataset in plain English — translating questions into DuckDB SQL over the same data the UI uses.
See it in action: diagnosing slow consumer disconnections after a deployment
Detection
Check Slow Consumers (SERVER_004) fires. Simultaneously, Connection Churn High (CLUSTER_006) triggers as evicted clients reconnect. The alert lands on a NATS subject the operator is already subscribed to — no dashboard polling, no delay.
Context gathering
The operator opens the server detail page. Slow consumer count, connection churn delta, and CPU load are all in the same view. The entity graph shows which accounts and streams are affected.
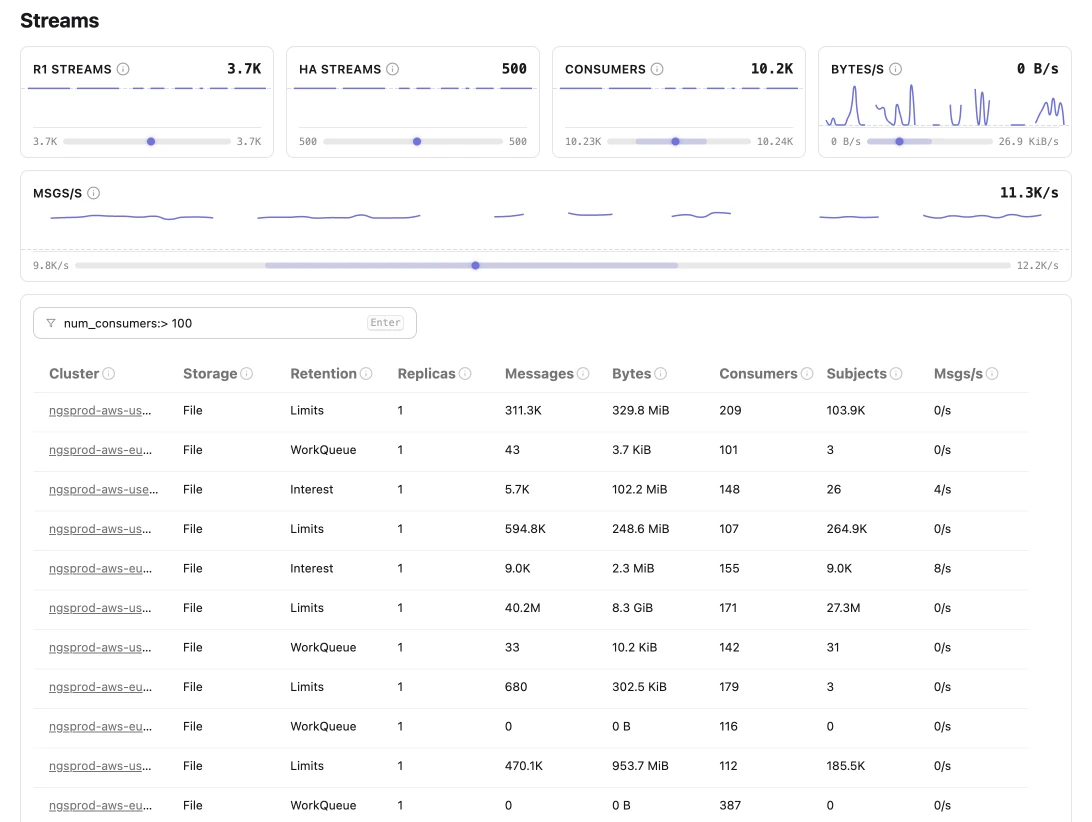
Entity traversal
From the server, the operator follows links to the affected account, then to its consumers. Ack Pending Buildup (OPT_SYS_003) is firing on several of them — messages aren’t being acknowledged fast enough.
Historical comparison
The operator pins the view to 24 hours ago. Consumer count has doubled since yesterday. The deployment added new consumers without accounting for the additional load on the underlying servers.
Remediation guidance
Each finding includes explicit next steps: scale out consumer instances, increase pending buffer sizes, or reduce message rates. The operator understands both the what and the why.
LLM-assisted action plan
The operator hands the findings to an agent equipped with the Insights CLI skill. The agent runs insights query to pull additional entity context and history, then generates a concrete plan: specific nats CLI commands to step down overloaded consumer leaders, a configuration change to increase max_ack_pending, and a recommendation to redistribute consumers across the cluster. The operator reviews and executes.
What used to take hours of CLI spelunking and cross-tool data-stitching now takes minutes.
Proactive optimization: catch problems before they page you
Not every use case is reactive. Run Insights continuously and Check results act as a recurring system health score, not just an incident trigger. Before things break, Insights can surface issues like:
- Uneven leader distribution (
OPT_BALANCE_001) before it quietly turns a healthy-looking cluster into a hotspot - Imports with no subscribers (
ACCOUNTS_005) before they become operational debt no one remembers creating - Security posture gaps like bearer token connections (
USER_001) before an audit finds them for you - Ack pending trends building toward a slow consumer cascade — visible in the time series long before the first eviction fires
The Check library represents what a healthy, well-configured NATS system looks like. Run it against your environment regularly to establish a baseline — then watch exactly where you’re drifting from it.
What about my existing monitoring stack?
NATS Surveyor / Prometheus / Grafana
The Surveyor → Prometheus → Grafana path is the standard starting point, and it works. But these tools weren’t built for high-cardinality data, which means going from “something’s wrong” to the specific entity causing degradation requires jumping between tools and manually correlating data. Insights handles the entity-level visibility that Prometheus wasn’t designed for.
NATS CLI / nats-audit
The NATS CLI is the power-user tool. When you know it well, it can tell you almost anything about server state. nats-audit even includes some of the same checks Insights runs. But CLI expertise doesn’t survive on-call rotation. It’s also point-in-time only; building historical context requires maintaining a custom data store.
Insights solves both: a structured interface for teams that aren’t CLI experts, and persistent historical data for everyone.
OpenTelemetry, Datadog, New Relic, Honeycomb, et al
General-purpose observability platforms are still a good idea. Insights complements them. APM tools can tell you your application is slow; they can’t tell you which JetStream consumer is causing it.
The inverse is also useful: when an application trace surfaces something unexpected, use the trace timestamp in Insights to see the exact state of the NATS system at that moment. Direct linking between OTel traces and Insights entity data is on the roadmap.
Synadia Control Plane
Control Plane covers a broader surface — authentication, authorization, JetStream asset management, high-level system visibility. Insights is purpose-built for deep, granular monitoring: entity-level investigation, historical comparison, and check-based diagnostics. A tighter integration between Control Plane and Insights — including automated remediation workflows — is planned.
Get started
Synadia Insights is available today as a 14-day self-serve trial. Sign up for the trial, download the binary, point it at your NATS system, and you’ll be collecting entity-level data and running Checks within minutes.
Related posts
All posts