Synadia Insights now monitors every NATS system you run, from factory floors to orbit

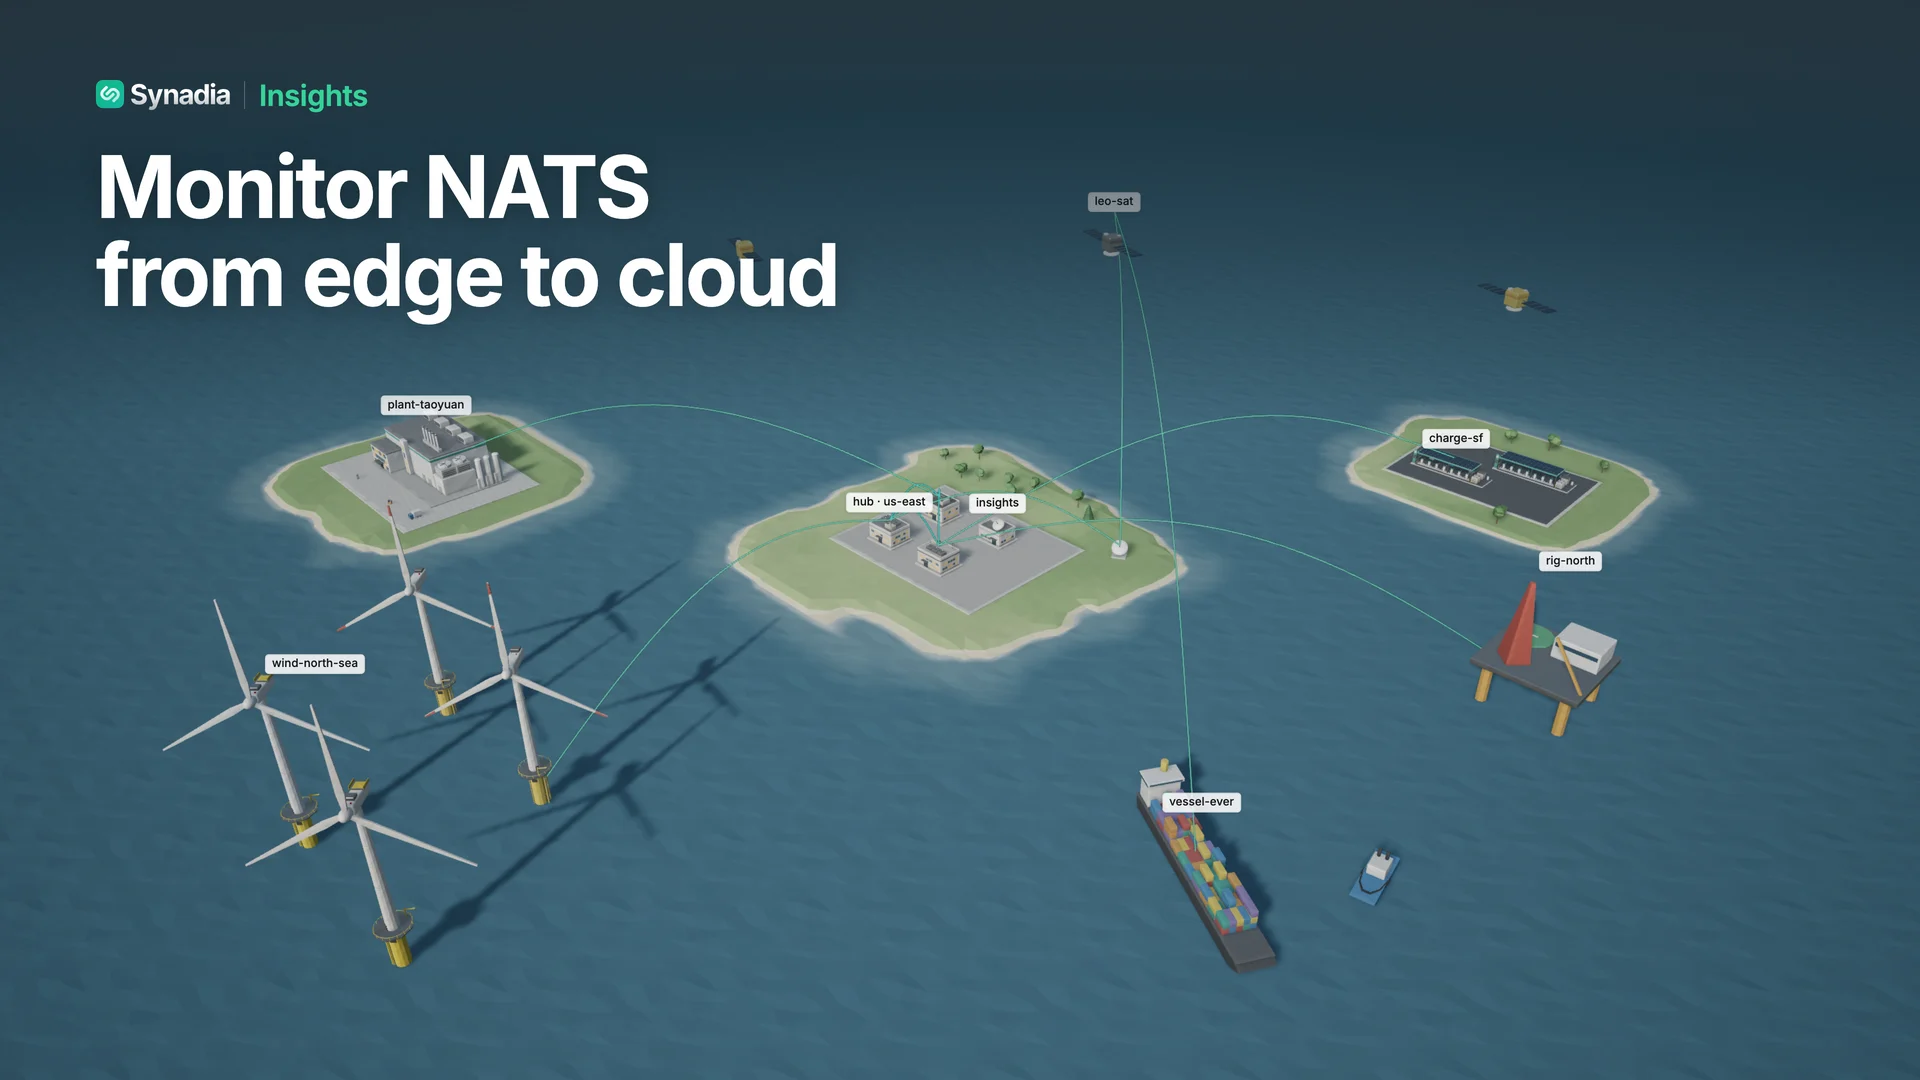
Many NATS servers never see the inside of a data center. NATS runs perfectly well in one, but it runs just as well on factory floors a few feet from the PLCs, in the base of wind turbines, inside EV chargers in parking garages, on delivery vehicles, and on satellites in orbit.
Each one is a small NATS system of its own, tied back to a cloud hub by a leafnode connection. That connection might be fiber at one site, a congested cell link at the next, or a few minutes of ground contact per pass for a satellite.
NATS was built for this kind of topology, and it handles those varied links well. What gets harder is seeing across all of it at once. When a consumer starts falling behind at one wind farm, someone at headquarters needs to know which site, which stream, and what changed. They need that without shipping every metric from every site to the cloud, and without logging into four hundred machines to find it.
Synadia Insights is now built for that kind of distributed, edge-to-cloud deployment. One Insights deployment can monitor any number of NATS systems, from a few hub clusters in one region to thousands of edge sites.
The same setup also covers the more traditional case of dev, staging, and production clusters kept fully apart. And when a check finds something at any of those sites, Insights can send it straight to the alerting tools your on-call team already uses.
The system account trade-off
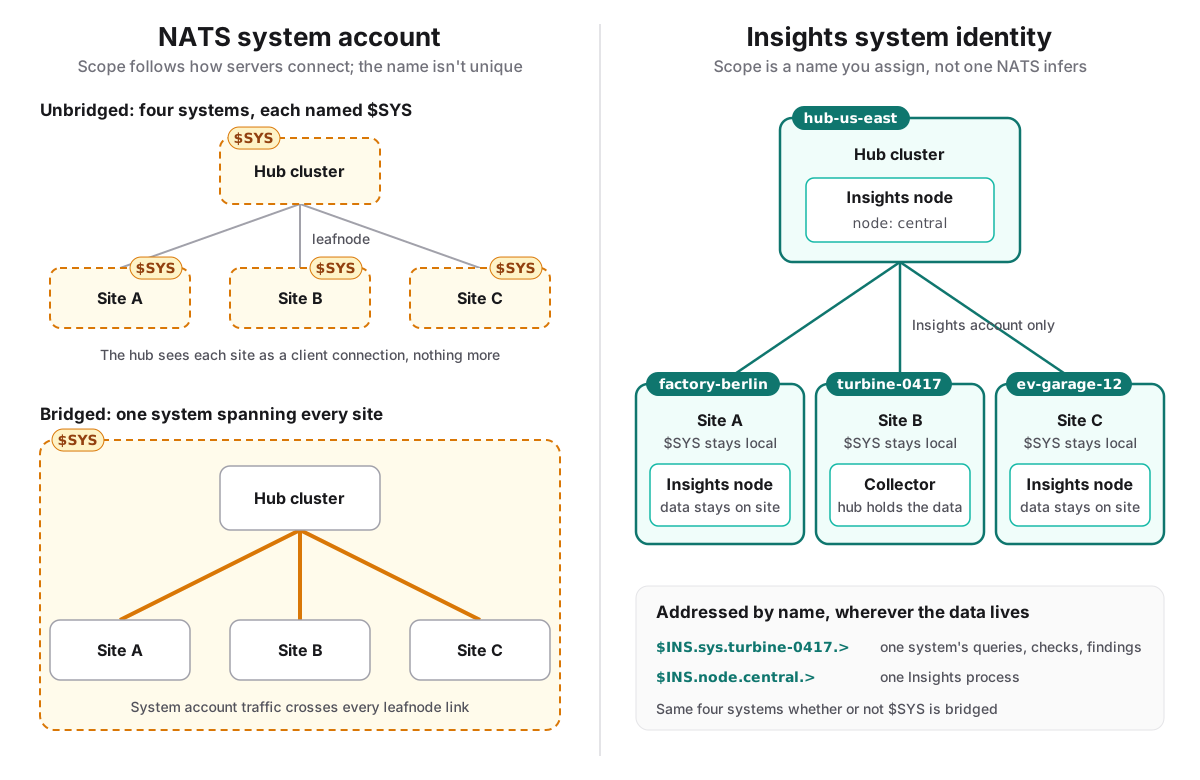
To NATS, a system is the set of servers that share a system account. That isn’t always the system you actually run. A cloud hub and its four hundred edge sites are one system to the team operating them, but with each site decoupled behind its own leaf node connection, they are four hundred and one separate systems by the NATS definition.
The only way NATS itself can inspect those edge sites from the hub is to bridge (i.e. share) the hub’s system account across each edge site. So teams monitoring distributed NATS deployments (one system? 401 systems?) hit this decision early.
Bridge it, and every edge server answers the hub’s monitoring requests, so you get a view across the fleet more or less for free. But it folds every site into the hub’s system, and a bridged system account sends far more traffic over each leafnode link. It isn’t the recommended practice.
Leave it unbridged, and each site stays separate. But from the hub, a site’s leafnode connection now looks like any other client connection, with nothing to say about the servers, streams, and consumers behind it. The team running the sites is left to deploy a Prometheus NATS exporter or NATS Surveyor at every site, then find a way to ship that data to a central view, which means more infrastructure to run at every site.
Insights is designed so you don’t have to choose. It adds a layer one level above the system account that models the system you actually run, hub and sites together, without changing how NATS sees them. Each site keeps its own system account and its decoupled leafnode connection, and Insights connects the sites to the hub over those same links using only its own dedicated account. Sites connect out to your hub, so there are no inbound ports to open at any site, and the central web UI reaches each site with no extra routing to set up.
That bridge is built to keep traffic down. With a full Insights node at a site, the data stays there and the hub queries it on demand, so little crosses the link until someone asks.
Findings are the exception, by design. Each site’s heartbeat carries its current findings, and Insights also publishes every finding as an event on its account the moment it fires. Because it’s all plain NATS, an integration can subscribe to that live feed wherever it runs, at the site or at the hub. You get on-demand queries for the detail and a real-time stream of what matters.
A system you name, not one NATS infers
The only identity NATS gives a system is its system account, and that isn’t unique across a fleet. Servers configured without an operator all default to a system account named $SYS. Under an operator, every site shares the operator’s system account key. Four hundred sites can report the same system account, and nothing in the monitoring data says which site is which.
So Insights doesn’t infer a system’s identity. You give each system an explicit id when you set it up, such as factory-berlin or turbine-0417, and that id becomes part of the NATS subject namespace Insights serves:
$INS.sys.turbine-0417.> queries, checks, and findings for one system$INS.node.central.> one Insights processEverything that works with a system, including the web UI, the CLI, the MCP server, and your own integrations, addresses it by that name. None of them need to know which Insights process holds its data, or whether that process runs at the site or at the hub.
The node id is the second half. It names an Insights process, not the NATS system it monitors. A node at a site serving one system takes that system’s id by default. A hub node serving many systems gets a name of its own, so you can still tell which process answers for what.
Two ways to run Insights at a site
A full Insights node. Collection, storage, and checks all happen at the site, so the site owns its own history. This is the right starting point for most sites. A factory can host the web UI on its own network and look at just its own system, while the central web UI can open that same site and dig in alongside every other. When it does, the query runs on the site, next to the data, and only the results stream back over NATS.
Apart from those on-demand queries, very little crosses the connection to the cloud: a heartbeat, the time of the latest collection, and the current findings. If the connection drops, the site keeps collecting and checking, and people working at the site can still use its local Insights to see what’s happening.
A collector. Some sites don’t have much to spare. Edge hardware often has a few CPUs, limited disk, and a link that comes and goes, and the monitoring data it holds only needs to last until it reaches the hub. For those sites, Insights now ships insights-collector, a separate binary roughly a quarter the size of the full one.
The collector runs beside the site’s NATS server, like a sidecar. It collects monitoring data and buffers it in a JetStream stream on that existing NATS server, and the hub mirrors the stream using JetStream’s native mirroring. The hub is where retention, queries, and checks happen. If the site loses contact, as a satellite does between ground passes, data keeps buffering locally within the stream’s limits and catches up with the hub when the connection comes back.
Not every site has someone to look at it. On a vehicle or a scooter, Insights can run headless: a full node answers queries on the device, or a collector ships data to the hub. Either way, the hub serves the web UI and sends alerts to your incident management tools.
Start with a full node wherever the site can spare memory and disk for a small database, which with light NATS traffic is smaller than you might expect. Use a collector where it can’t. Keep in mind that a collector sends everything it collects upstream, so its collection interval sets how much bandwidth it uses. You can mix both in one deployment, and the hub can monitor its own cluster alongside everything else. The federated deployment guide walks through both setups.
Already bridging the system account?
Plenty of fleets bridged the system account long before Insights existed, and re-plumbing every leafnode is not a first-week project. Insights works with that too. On a bridged system account, every server in the fleet answers the same monitoring requests, so an Insights system is defined by which of those servers it collects from. Each node or collector can be limited to a subset of servers by server name, cluster, or server tag. Servers outside that subset get no monitoring requests from it at all.
Give each site a system id and a filter that matches its servers, and you get the same per-site systems as an unbridged deployment, with the same names, subjects, and alert labels:
system: id: factory-berlinscraper: filter: allow: tags: [site:factory-berlin]If you later unbridge the system account, the system ids stay the same, so alert routes and integrations that address a system by name don’t change.
Many systems on one node
Most multi-system deployments don’t reach orbit. If you run separate dev, staging, and production clusters, or regional clusters that were never joined into a supercluster, one Insights node can collect from all of them directly. Each system has its own connection, collection interval, and retention, along with its own database, stream, check thresholds, and API. Nothing is shared between them. If one system’s database fails to open, Insights logs the problem, skips that system, and keeps monitoring the others while it retries.
One view across every system
Once every system is connected, the next problem is spotting the one site that needs attention, and hearing about it before anyone goes looking.
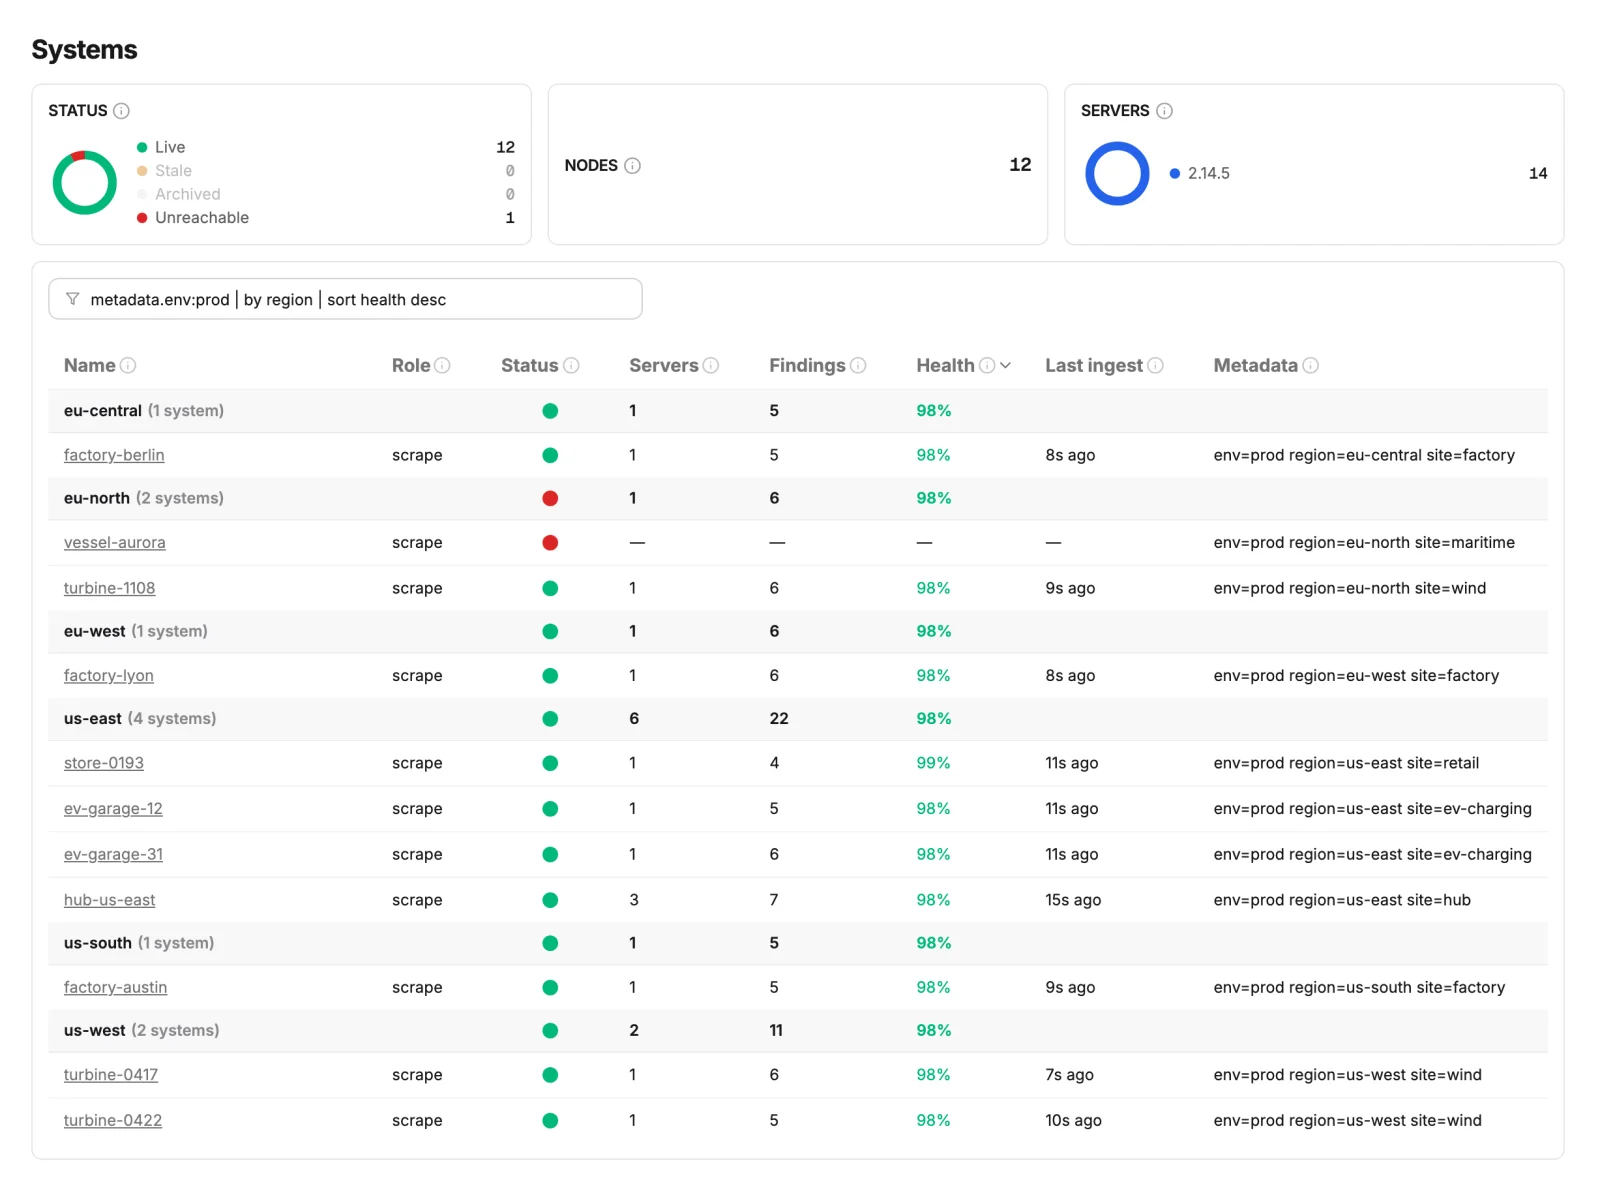
Multi-system support runs through every way you work with Insights. In the web UI, once a node has more than one system, a top-level Systems page lists them all with their status and health. Open any system and you see the same views as before, with a switcher to jump to the next one. A single-system deployment looks the same as it always has.
Once a fleet runs past a few dozen sites, scrolling a list stops working. Insights now lets you attach your own labels to every node and system (region, environment, site type, whatever matches how you think about the fleet) and then filter, group, and sort by them on any list page:
metadata.env:prod | by region | sort health descA group header shows the worst value in the group rather than the average, because one unreachable site in a group of twenty is the thing you need to notice.
The NATS API, the CLI, and the MCP server all take a system name, and the agent skill built into the CLI and the MCP server knows how to pick one. Each query runs against one system, wherever that system’s data lives. For a question that spans the fleet, such as which sites have a consumer falling behind, an agent can run the same query against every system and compare what comes back.
New since launch: an MCP server for AI agents
Insights now includes a built-in Model Context Protocol (MCP) server, so Claude Code, Claude Desktop, Cursor, and other MCP clients can work with your NATS data directly. Run
insights mcpand an agent can explore the schema, run SQL, and pull check findings, then answer questions like “which servers have the highest CPU right now?”It’s read-only by design. The server rejects writes on its own, whatever the agent asks for, and it can only see what its NATS credentials allow. Every tool takes a system name, so one agent session can work across your whole fleet, one system at a time. See the AI agents guide to connect one.
Webhooks and alerts from Insights
A dashboard only helps when someone is looking at it. Insights runs more than 100 checks on every collection, and now gives you finer control over where those findings go.
After each collection, Insights compares every system’s findings with the previous run and sends the changes: a finding that started firing, one that resolved, or one whose severity changed. Nothing is sent while a finding stays the same, so a long-running issue doesn’t page anyone twice.
There are two endpoint types:
- Webhooks receive the full payload in the Alertmanager
webhook_configformat, so any receiver that already accepts it works without changes. Requests can be signed with HMAC-SHA256 or sent with basic or bearer auth. - Alertmanager endpoints receive alerts in the Alertmanager v2 API format. Insights re-sends anything still firing once a minute, so Alertmanager keeps the alert open while the problem lasts and resolves it on its own when Insights stops sending it.
You choose which checks each endpoint hears about with wildcard patterns, such as every server check or every stream check, then carve out exceptions with an ignore list. You can also limit an endpoint to particular systems, so production findings can page on-call while staging findings go to a team channel. Every alert carries a system label, which means a fleet of edge sites can share one Alertmanager route and still group alerts by site.
Upgrading and getting started
Existing single-system configs keep working after the upgrade, and the database and check history migrate on first start. Check codes were renamed in this release (SERVER_001 is now server-001, and the OPT_* prefixes are gone), so if your config names check codes, run insights config check with the new binary before you restart. It points to every code and parameter that changed. The upgrade guide covers the rest. Insights now requires NATS Server 2.10.27 or later.
If you’re new to Insights, the launch post covers the basics, or you can start a 30-day trial. The built-in simulator lets you look around before you connect a real system. To set up a multi-site deployment, the federated deployment guide walks through the leafnode bridge, the JetStream domains, and permissions, and the notifications guide covers webhook and Alertmanager setup end to end.
Related posts
All posts